Industrial Internet of Things,
Sibur, 2021
Sibur is the largest petrochemical company in Russia. There is a lot of equipment in Sibur factories with parameters that need to be controlled: pressure, temperature and so on. We developed a system that gathers and visualises this information and helps to react quickly to any malfunction.
I joined the team in 2019 and designed all the interfaces for the system in a year.
All the equipment in Sibur’s factories requires constant monitoring because it should not to break down, work on schedule and be safe for people and the environment. Earlier factory workers used to solve this task manually. They moved around the factory from one machinery to another and recorded the values of temperature and other parameters in a journal:
The team I joined was developing an industrial Internet of thing system that consisted of two products: firstly, sensors that are set up on a piece of equipment that needs to be controlled and measures one or other parameters, and secondly, software that gathers and visualises readings from sensors and also allows to manage their work.
By the moment I joined the team some prototype sensors had been released and set up on testing equipment but the development of software had just begun.
The sensors measured all the necessary parameters automatically so it required only one employee – we called him an operator – to monitor the readings from it instead of several workers who had made rounds before. Thus the system allowed the company to save on quantity of employees but this wasn’t enough.
The main goal was to shrunk time from the start of the problem to its end. Previously, it took at least 2 hours.
It was one of the tasks I needed to resolve, and I proposed 3 solutions to solve it.
Solution 1: Notifications
At first — a list of events (left part of the screen):
An event is a value of the parameter that needs an operator’s attention: an increase of critical values (for example, too high temperature), or drastic change in values (for example, a very rapid decrease in pressure), or the absence of a signal, and other.
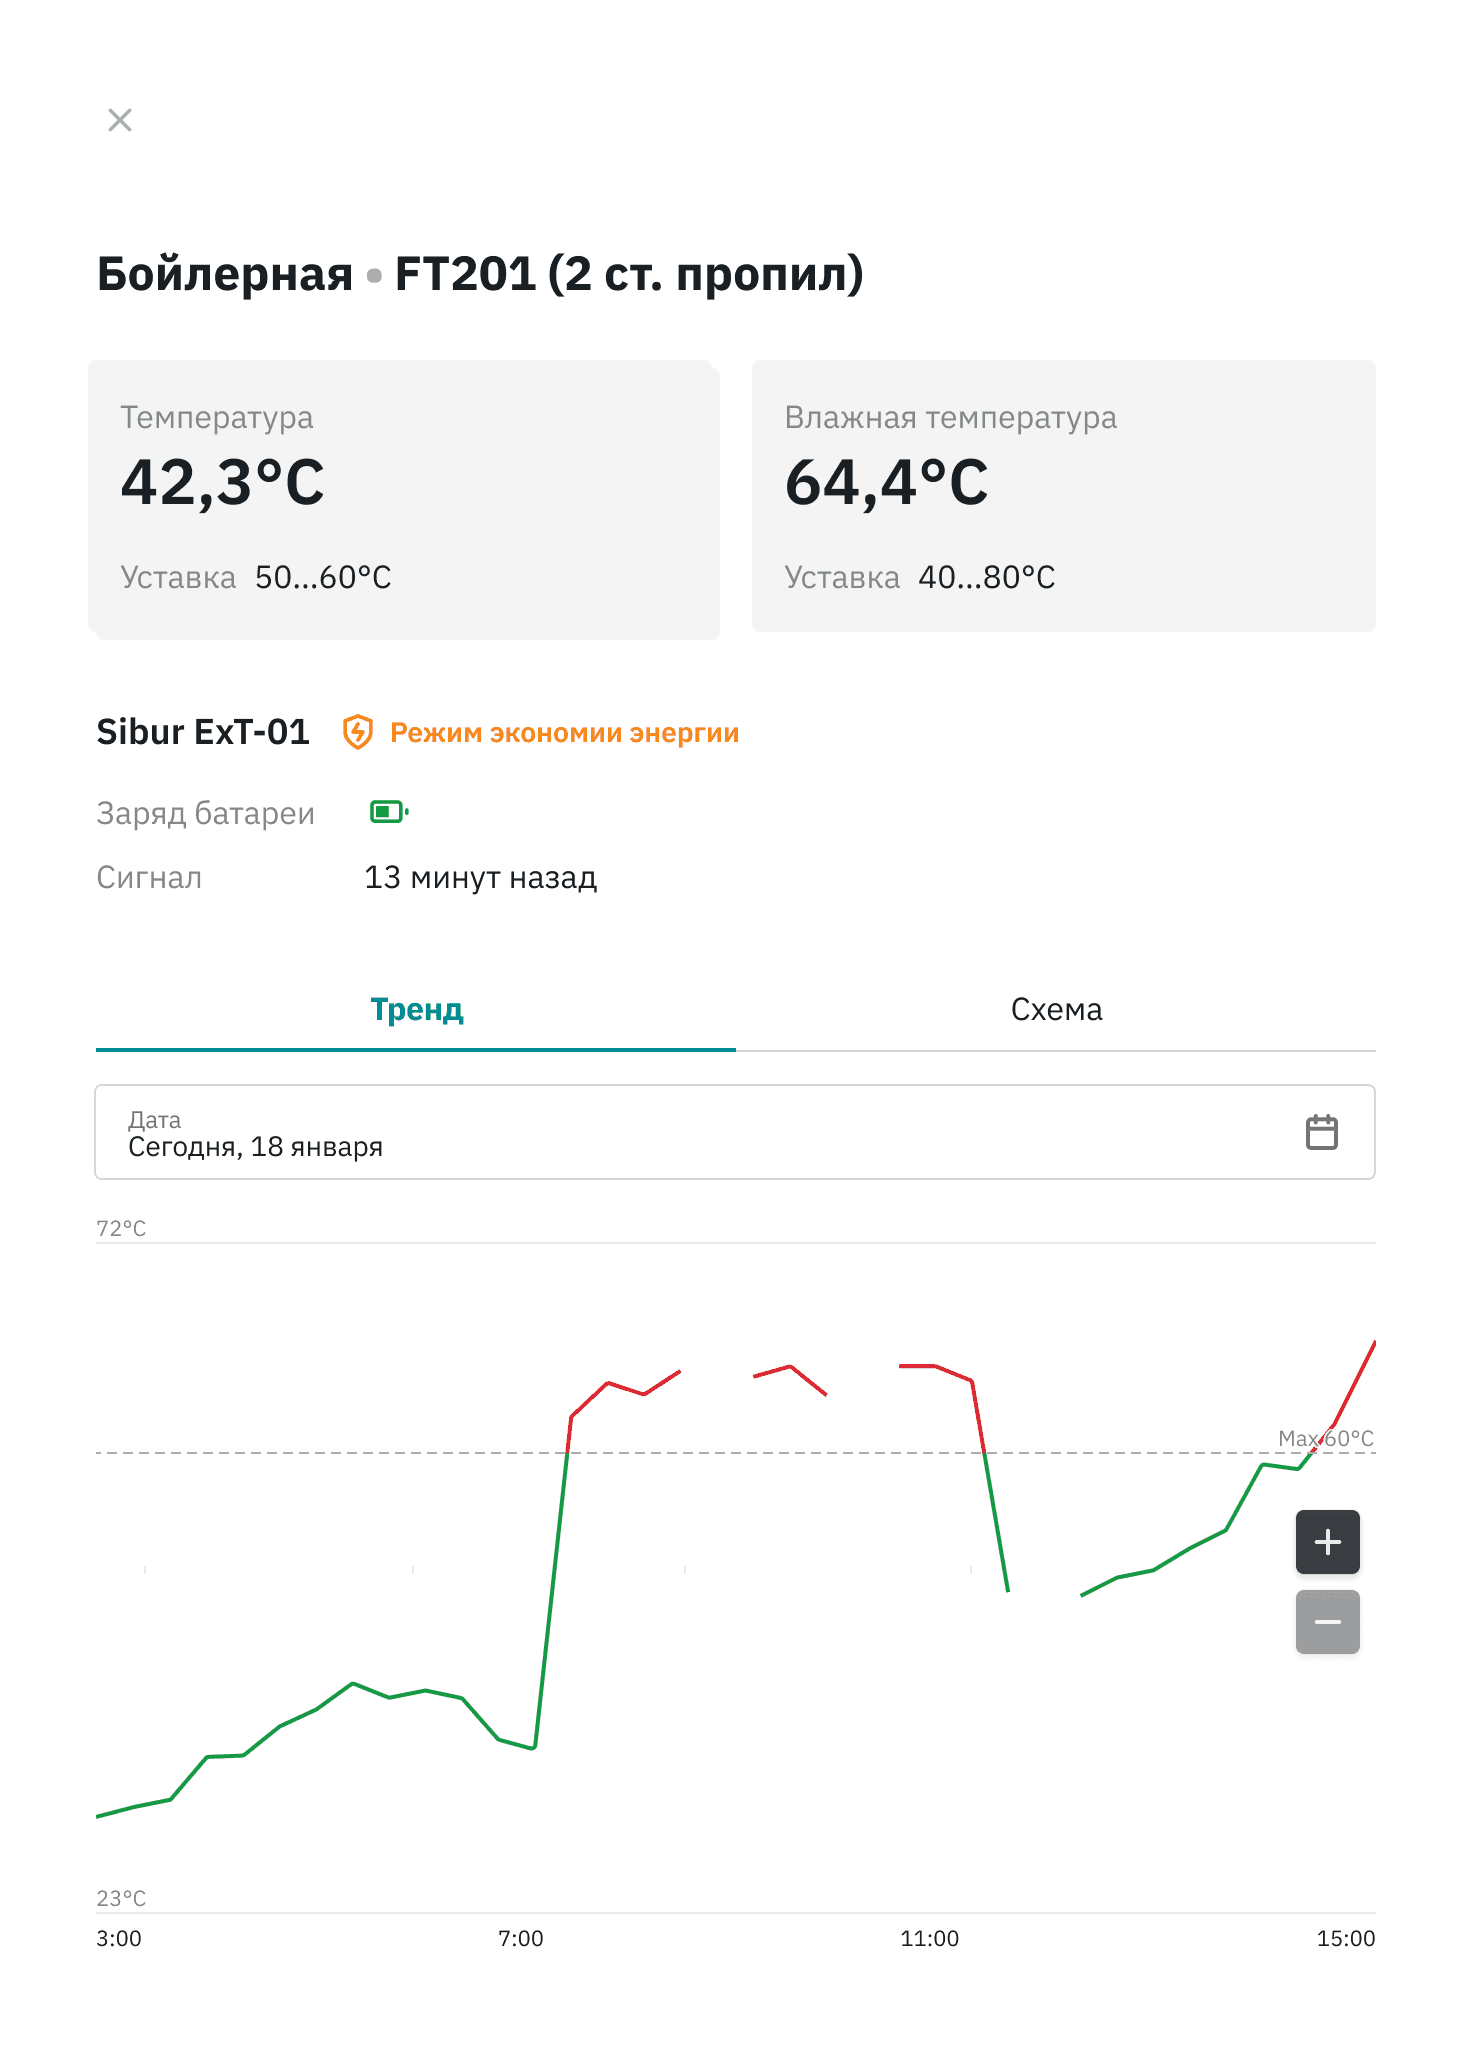
An operator can immediately give the information about the event to the field worker whose task is to correct the operation of the equipment. Also, an operator can click on the event and check the additional information about the equipment, its location and how it has been working for the last few hours:
This solution allowed us to reduce the time from the start of the problem to its end from 2 hours to 20 minutes in the first iteration and to 3 minutes in the second one.
The second solution is to display graphics that show how values from the sensors change over time. In this way, an operator can make decisions proactively and notice strange readings from sensors beforehand.
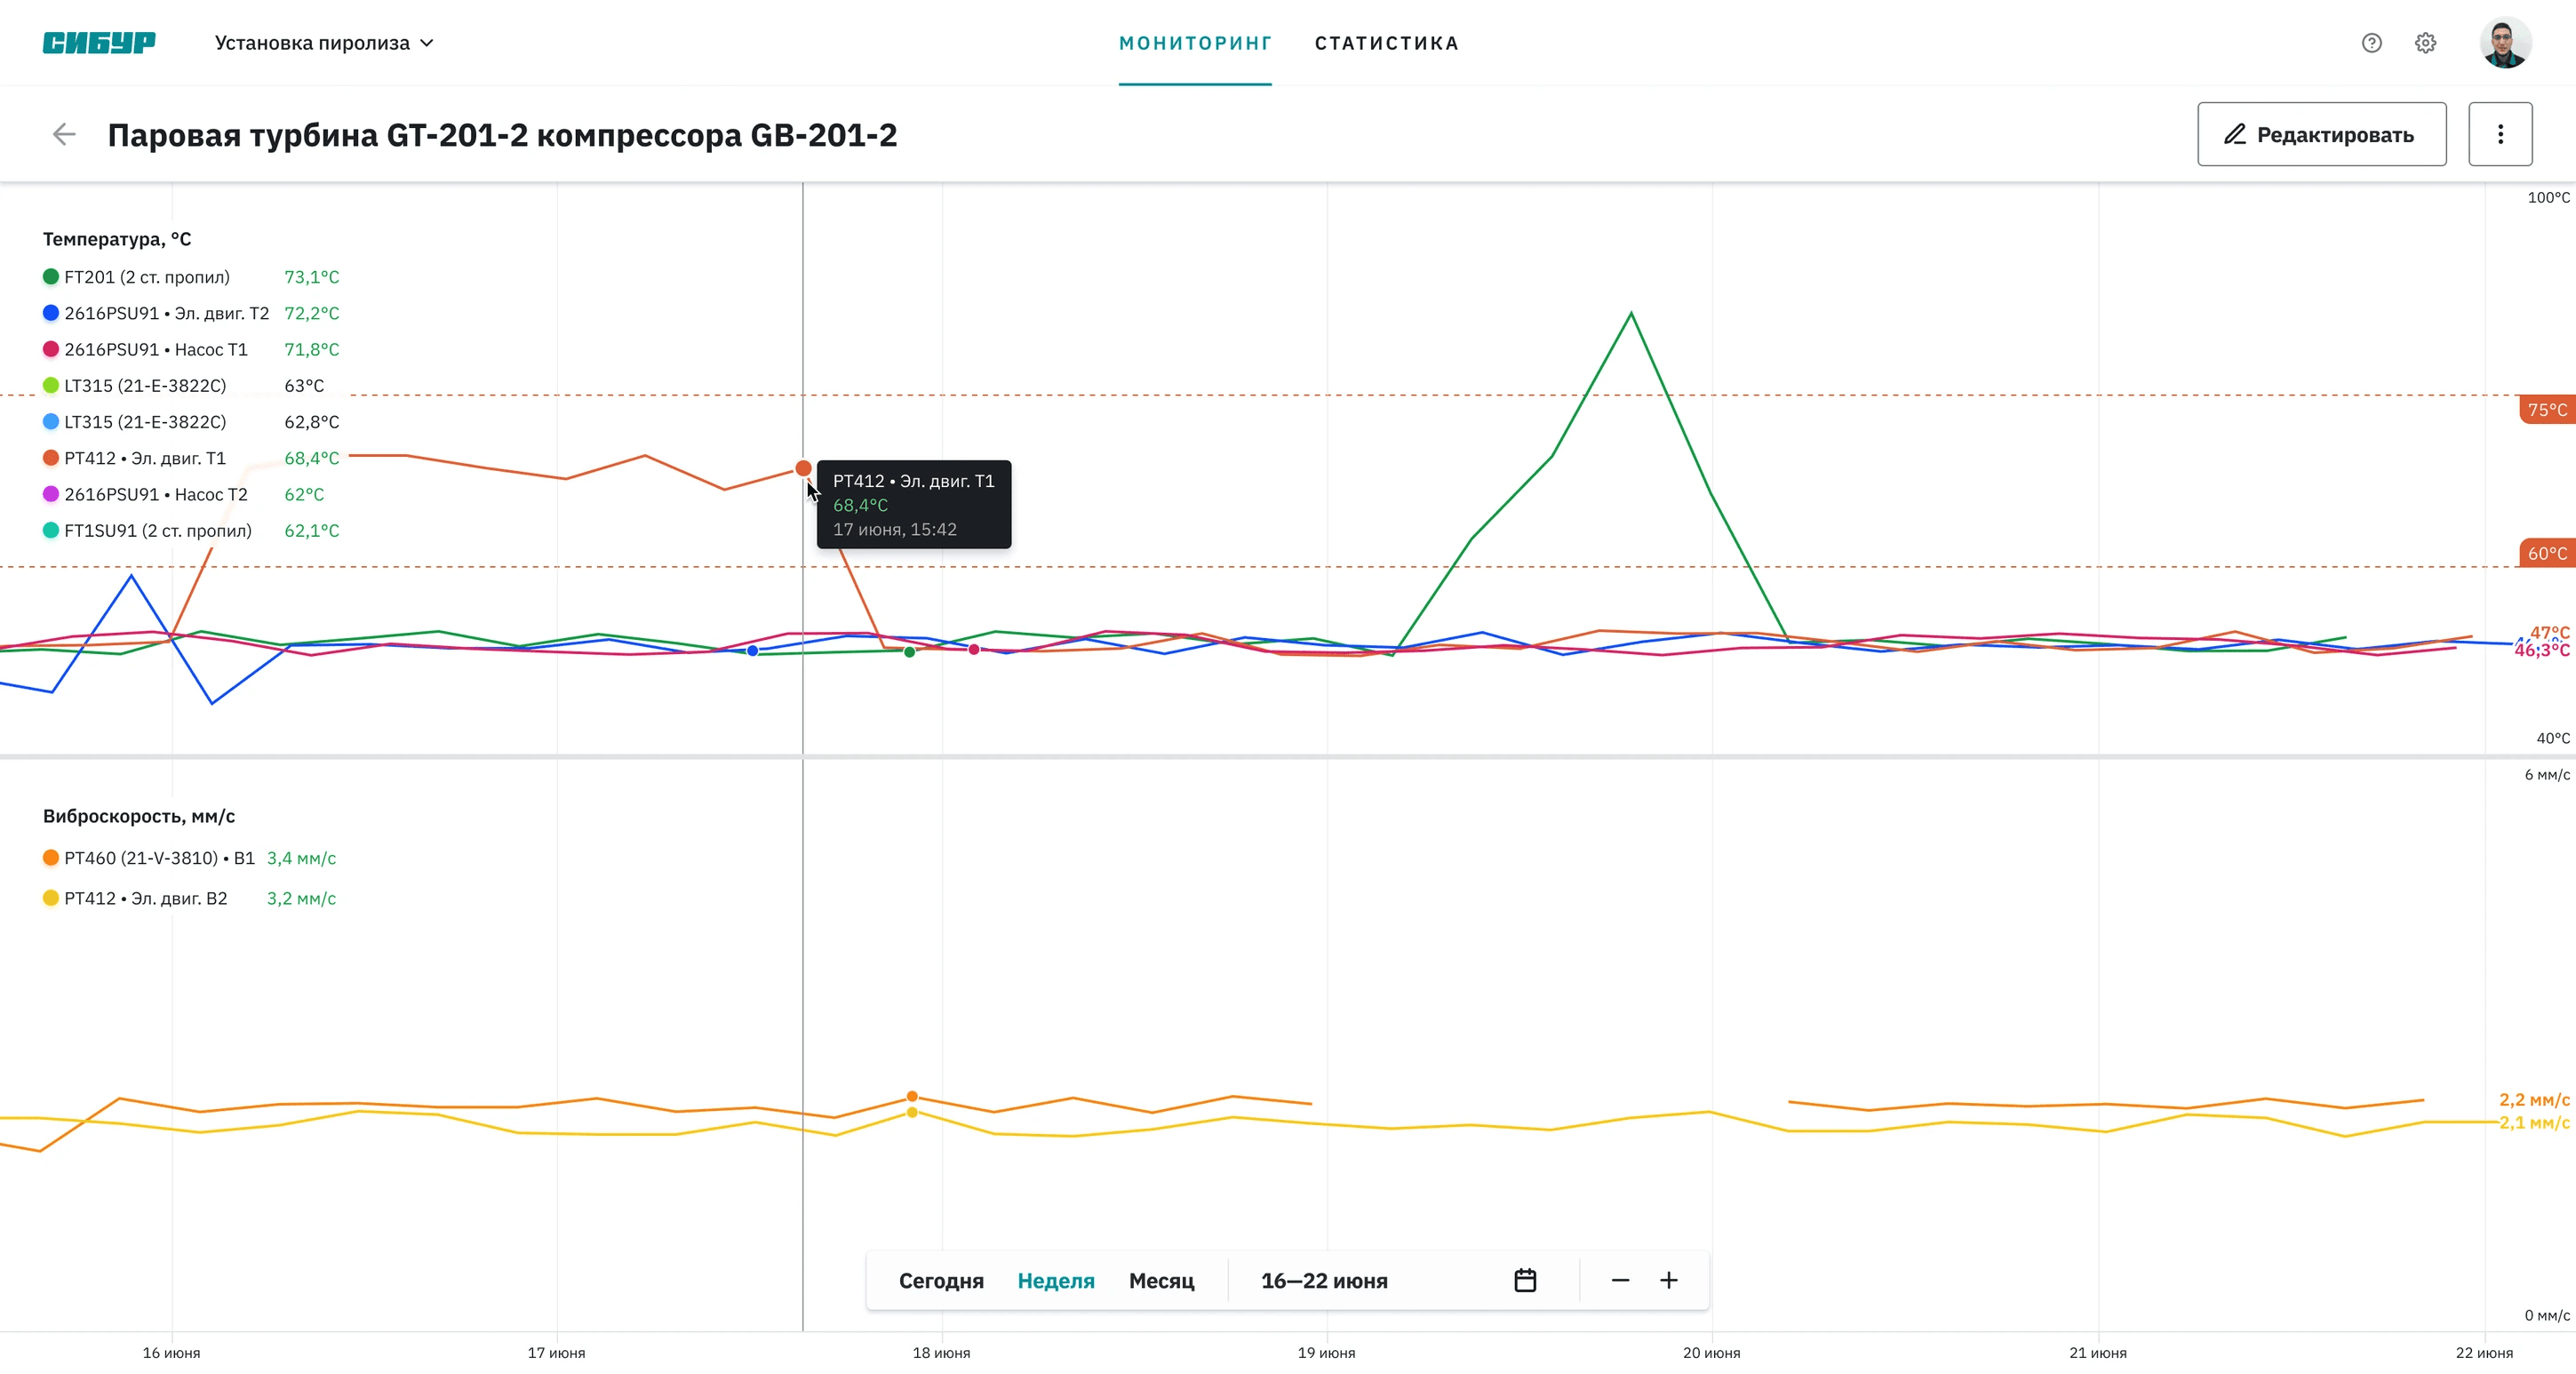
In the first iteration, we showed graphics from each sensor separately. In the second one, we showed graphics from several sensors at one time, and it allowed users to find dependencies between readings:
This solution, alone with others, reduced the number of critical situations by 10%.
Besides monitoring sensor readings, an operator had other duties, and this was one of the reasons why he reacted to some events with a delay. At the same time, each operator was responsible for his section of the factory, and while one operator could have no events, another one could have many of them.
We had several ideas of how to solve this problem: from sending messages to the operator’s phone to developing a mobile app. That would help the operator to monitor the operations of the equipment while he is not at his workplace. But these solutions required a lot of resources, and we decided to show events from all sensors to a large screen in the control room that was able to be seen by everyone in this room:
By the beginning of 2021, our sensors and IoT platform had launched in 9 factories out of 23 and helped Sibur to save about one million dollars.
Our solutions allowed us to reduce the time from the start of the malfunction to its detection from 2 hours to 3 minutes on average.
The implementation of graphics allowed us to prevent malfunctions in advance and decrease their number by 10%.
In addition, our decisions helped to reduce the number of employees who worked on monitoring the parameters of the equipment to one person per factory section and to direct those resources to more productive and creative activities.
Do not take a solution suggested by a user. It was my first time working on a B2E product, and there was a temptation to trust the ideas of users because they are professionals in their field. But being a professional in the oil and gas industry and testing your hypotheses are not the same thing.
Do not grab the first decision that comes to mind. We could have avoided unnecessary waste of time and money if we had spent more time on testing our solutions.
Do validate solutions when launching a product to a new group of users. In our case, the needs of users in different factories differed sometimes, and we should have spent more time studying the new audience.